lightsf: A Curated Collection of Georeferenced and Spatial Datasets
Source:vignettes/lightsf_vignette.Rmd
lightsf_vignette.Rmd
library(lightsf)
library(ggplot2)
#> Warning: package 'ggplot2' was built under R version 4.4.3
library(dplyr)
#> Warning: package 'dplyr' was built under R version 4.4.3
#>
#> Attaching package: 'dplyr'
#> The following objects are masked from 'package:stats':
#>
#>     filter, lag
#> The following objects are masked from 'package:base':
#>
#>     intersect, setdiff, setequal, union
Introduction
The lightsf package offers a curated and diverse
collection of georeferenced and spatial datasets from various
domains, enabling researchers, educators, and analysts to easily explore
spatial patterns and perform geostatistical analysis in R.
This package consolidates datasets from multiple open and trusted sources, including Kaggle, spData, adespatial, chopin, and bivariateLeaflet, to provide a unified resource for spatial data exploration and visualization.
The datasets included in lightsf cover a broad spectrum
of topics such as urban studies, housing markets, environmental
monitoring, transportation networks, and socio-economic
indicators. Each dataset is carefully formatted and documented
to support both educational purposes and
applied spatial analysis.
lightsf provides data in multiple spatial formats
—including point patterns, polygons,
socio-economic data frames, and network-like
structures— allowing users to perform tasks ranging from
basic exploratory mapping to advanced spatial
modeling.
By centralizing geospatial datasets in a single package,
lightsf simplifies the workflow for those who wish to
learn, teach, or apply spatial data science techniques without the need
to gather and preprocess data from multiple sources.
Dataset Suffixes
Each dataset in the lightsf package uses a
suffix to indicate the type of spatial data it
contains:
_pts: Refers to point-based datasets that include georeferenced locations, usually represented by latitude and longitude coordinates._poly: Refers to polygon-based datasets, typically representing areas, administrative boundaries, or spatial zones._points: Refers to point datasets similar to_pts, often derived from other spatial sources or including additional spatial or attribute information.
These suffixes help users quickly identify the geometric
structure and spatial representation of each
dataset included in the lightsf package.
Example Datasets
Below are selected example datasets included in the
lightsf package:
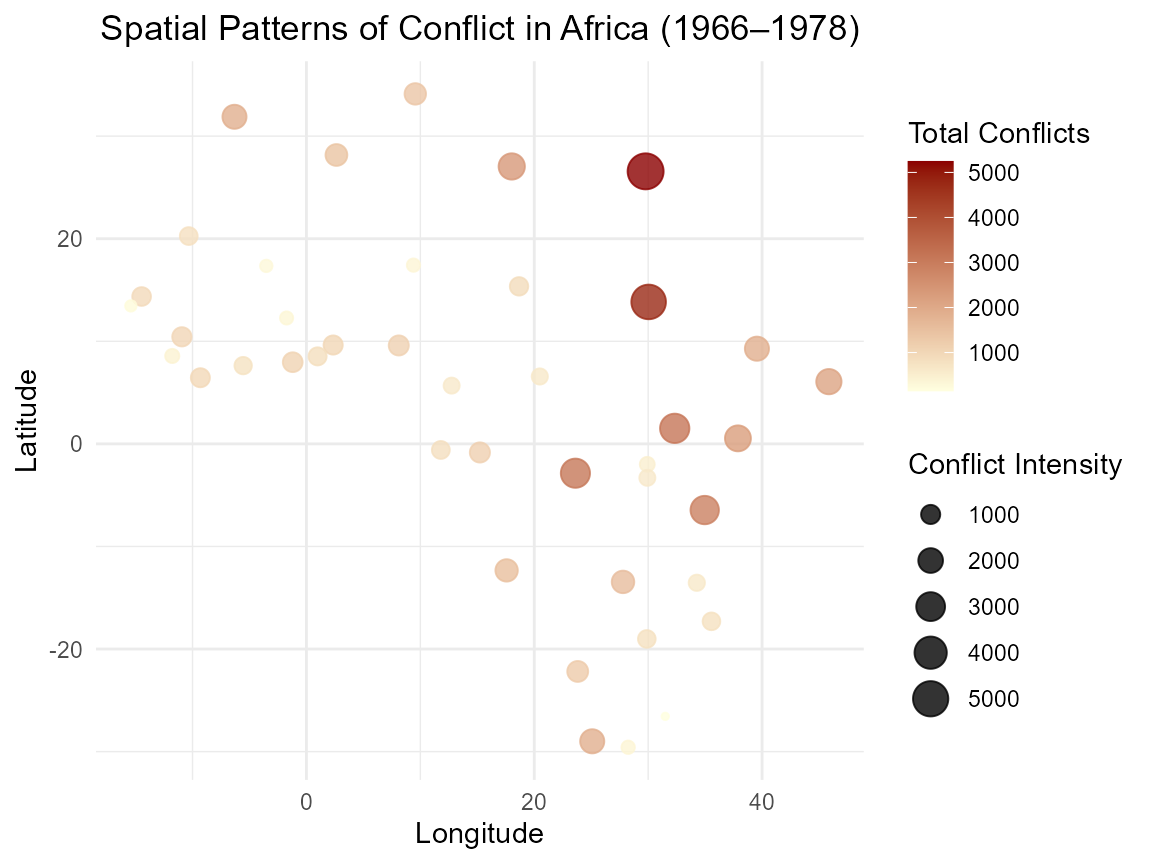
nc_points: Mildly clustered georeferenced points representing locations in North Carolina, United States.dc_poly: Polygon-based spatial dataset containing Washington D.C. census tract data, suitable for creating choropleth maps and exploring demographic or spatial patterns.afcon_poly: Polygon dataset representing spatial patterns of conflict in Africa (1966–1978), useful for studying regional clustering and spatial heterogeneity.
Data Visualization with lightsf Data
Spatial Patterns of Conflict in Africa (1966–1978)
# Basic exploration of the dataset
names(afcon_poly)
#> [1] "x"      "y"      "totcon" "name"   "id"
class(afcon_poly)
#> [1] "data.frame"
length(afcon_poly)
#> [1] 5
str(afcon_poly)
#> 'data.frame':    42 obs. of  5 variables:
#>  $ x     : num  9.56 2.63 -6.32 18.02 29.77 ...
#>  $ y     : num  34.1 28.2 31.9 27 26.6 ...
#>  $ totcon: num  1363 1421 1861 2355 5246 ...
#>  $ name  : Factor w/ 42 levels "ALGERIA","ANGOLA",..: 38 1 24 20 11 23 22 26 9 33 ...
#>  $ id    : num  2040 2039 2038 2041 2043 ...

# Ensure the dataset is a data frame
afcon_df <- as.data.frame(afcon_poly)

# Create a scatter plot of coordinates colored by total conflicts
ggplot(afcon_df, aes(x = x, y = y)) +
  geom_point(aes(color = totcon, size = totcon), alpha = 0.8) +
  scale_color_gradient(low = "lightyellow", high = "darkred") +
  labs(
    title = "Spatial Patterns of Conflict in Africa (1966–1978)",
    x = "Longitude",
    y = "Latitude",
    color = "Total Conflicts",
    size = "Conflict Intensity"
  ) +
  theme_minimal() +
  theme(
    plot.title = element_text(hjust = 0.5),
    legend.position = "right"
  )
Conclusion
The lightsf package provides a curated and
diverse collection of georeferenced and spatial datasets
designed to support spatial data analysis, visualization, and education
in R.
It brings together datasets from multiple open sources, offering
ready-to-use spatial data covering topics such as urban studies,
housing markets, environmental monitoring, transportation, and
socio-economic indicators.
By providing well-structured and documented datasets in various
spatial formats, lightsf facilitates exploratory
mapping, geostatistical modeling, and
teaching of spatial analysis concepts.